Statistical Process Control is a methodology of statistical analysis used to discover special cause variation in a process. In healthcare, it is used to document that a critical process is in control and alert responsible parties should there be a deviation. A typical control chart is a graphical representation of the quality indicator, as either individual values or calculated subgroups with the data displayed sequentially and time ordered [Refer to illustration 1 in Appendix]. Horizontal lines represent the central tendency (mean), upper and lower control limits typically set at +3 standard deviations from the mean [1]. In this paper, we will list down the types of control charts available and guidelines to interpret it.
Types of Control Charts
In 1920s by Walter Shewhart developed it to improve industrial manufacturing. It first migrated to healthcare in laboratory settings and then into direct patient care applications [2].
There are four commonly used control charts [Refer to illustration 2, 3 in Appendix]. Control are categorized as upper (+) and lower (-).

A process is “in control” when it has the following characteristics [3]:
No points are outside the control limits – the traditional and most popular SPC chart guideline,
The number of points above and below the center line is about the same,
The points seem to fall randomly above and below the center line,
Most points, but not all, are near the centerline, and only a few are close to the control limits.
Evaluating the “patterns in the sample data” using guidelines such as [Refer to illustration 4 in Appendix]:
Eight points in a row above or below the center line
10 of 11 consecutive points above or below the center line
12 of 14 consecutive points above or below the center line
Two of three consecutive points in the outer one-third region between the center line and one of the control limits
Four of five consecutive points in the outer two-thirds region between the centerline and one of the control limits.
Basic Guidelines
In general, in applying statistical process control, we need to delineate the following:
The study and design objectives
Study settings - entire hospital, department etc
Fields of healthcare – anesthesia, pathology etc
Unit of analysis – Clinicians, patient, staff etc
Variables – Oxygen saturation, time to complete etc
Benefits – Impact assessment, quantify process variability etc
However, a number of special issues arise in health care applications of SPC. One of these is the question of what to measure. In health care applications, there is concern and debate about excessive emphasis on outcome metrics and report cards to the detriment of process understanding and improvement. Another issue is the problem of how to aggregate, adjust, and present rate data, used to make decisions [5].
Conclusion
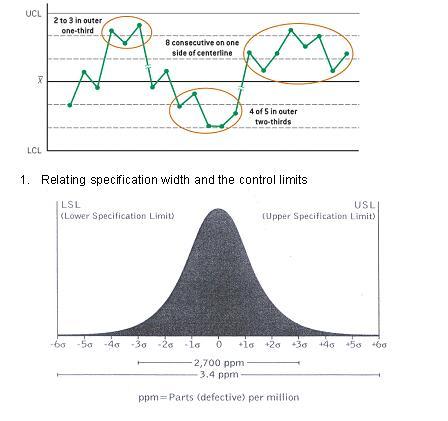
Control charts provide an effective method to visualize data over a specific monitoring period while considering for boundary conditions. Usually the control limits are well within the specification limits for a capable process [Refer to illustration 5 in Appendix]. Continuing use of the control chart helps to check if the corrective action has resulted in an improved process. They allow hospital administrators to have a more engaging conversation with the physicians in the wake of the collected data. When shared between providers, control charts they drive higher standards of care. Patient identification and non-infectious hazards of transfusion are some typical bio-vigilance areas where software process control finds effective application.

References
[1] Continuous quality improvement of perfusion practice. The role of electronic data collection and statistical control chart. RA Baker, RF Newland. Perfusion 2008 23:7-16
[2] Application of statistical process control in healthcare improvement: systematic review. Johan Thor, Jonas Lundberg, Jakob Ask, Jesper Olsson, Cheryl Carli, Karin Pukk Ha¨renstam, Mats Brommels. Qual Saf Health Care 2007;16:387–399. doi: 10.1136/qshc.2006.022194
[3] Operations Management, D.A. Collier, J.R. Evans(2007)
[4] Errors in patient specimen collection: application of statistical process control. Walter Sunny Dzik, Neil Beckman, Kathleen Selleng, Nancy Heddle, Zbigniew Szczepiorkowski, Silvano Wendel, and Michael Murphy for the Biomedical Excellence for Safer Transfusion (BEST) Collaborative (2008)
[5] Health Care Applications of Statistical Process Control: Examples Using the SASâ System Robert N. Rodriguez SAS Institute Inc. Cary, North Carolina, USA