I was listening to some podcasts on guidonps.com. The speaker is Ron Wince, CEO of Guidon Performance Solutions. Some worthwhile nuggets from what I heard.
It seems everyone in healthcare is jumping on to LSS bandwagon, but mostly it has been used as a tactical toolbox until now. Off late people are realizing that they need to learn to do it well. LSS seems to be the bridge to bring about the socio-technical change. Hospitals are under pressure for a long time for reimbursement, cost and revenue realization. Health reform is driving this urgency. Key drivers pushing LSS adoption are (http://www.ache.org/pubs/research/ceoissues.cfm)
# Changes in revenue model from inpatient to outpatient
# Reimbursement rates going down
# Transparency issues
# Consumer education
# EMR adoption(financial incentives at risk)
It seems that current health reform will call for a management/financial reform.
Continuous Improvement seems to be something we must do everyday, but not everyone is mature enough to think that way. CI is about making the jump up from the last achieved level. Voice of the customer is the only guide to CI initiative. It is not uncommon to see that CI being a knee jerk response to a crisis. LSS is a combination of process refinement and leadership committment to work ON the business and not merely work IN the business. Is measurement an obsession or do we need a balance between results and KPI. Typically only 5% of the work done by an organization is value adding from a customer point of view !!!!!!!!!. 50% of the non value added activity can really be rid of immediately (it is neither regulotory nor compliance).
The IT footprint (human resources) in the healthcare providers is low and there will be a strong need for contracted IT. The health IT companies are likely to do well in the coming times. It is likely to take anywhere between 10 to 20 years before the healhcare bill to be implemented.
Showing posts with label Six Sigma. Show all posts
Showing posts with label Six Sigma. Show all posts
Monday, January 31, 2011
Wednesday, July 7, 2010
Control Charts in healthcare
Control Charts in healthcare
Statistical Process Control is a methodology of statistical analysis used to discover special cause variation in a process. In healthcare, it is used to document that a critical process is in control and alert responsible parties should there be a deviation. A typical control chart is a graphical representation of the quality indicator, as either individual values or calculated subgroups with the data displayed sequentially and time ordered [Refer to illustration 1 in Appendix]. Horizontal lines represent the central tendency (mean), upper and lower control limits typically set at +3 standard deviations from the mean [1]. In this paper, we will list down the types of control charts available and guidelines to interpret it.
Types of Control Charts
In 1920s by Walter Shewhart developed it to improve industrial manufacturing. It first migrated to healthcare in laboratory settings and then into direct patient care applications [2].
There are four commonly used control charts [Refer to illustration 2, 3 in Appendix]. Control are categorized as upper (+) and lower (-).

A process is “in control” when it has the following characteristics [3]:
No points are outside the control limits – the traditional and most popular SPC chart guideline,
The number of points above and below the center line is about the same,
The points seem to fall randomly above and below the center line,
Most points, but not all, are near the centerline, and only a few are close to the control limits.
Evaluating the “patterns in the sample data” using guidelines such as [Refer to illustration 4 in Appendix]:
Eight points in a row above or below the center line
10 of 11 consecutive points above or below the center line
12 of 14 consecutive points above or below the center line
Two of three consecutive points in the outer one-third region between the center line and one of the control limits
Four of five consecutive points in the outer two-thirds region between the centerline and one of the control limits.
Basic Guidelines
In general, in applying statistical process control, we need to delineate the following:
The study and design objectives
Study settings - entire hospital, department etc
Fields of healthcare – anesthesia, pathology etc
Unit of analysis – Clinicians, patient, staff etc
Variables – Oxygen saturation, time to complete etc
Benefits – Impact assessment, quantify process variability etc
However, a number of special issues arise in health care applications of SPC. One of these is the question of what to measure. In health care applications, there is concern and debate about excessive emphasis on outcome metrics and report cards to the detriment of process understanding and improvement. Another issue is the problem of how to aggregate, adjust, and present rate data, used to make decisions [5].
Conclusion
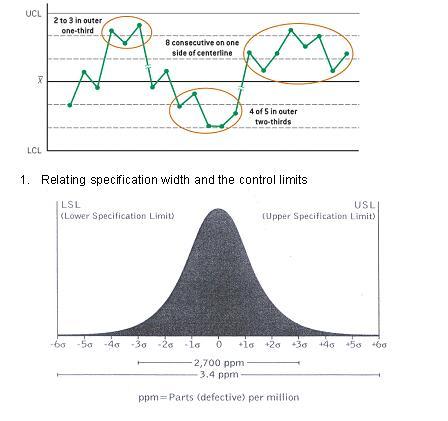
Control charts provide an effective method to visualize data over a specific monitoring period while considering for boundary conditions. Usually the control limits are well within the specification limits for a capable process [Refer to illustration 5 in Appendix]. Continuing use of the control chart helps to check if the corrective action has resulted in an improved process. They allow hospital administrators to have a more engaging conversation with the physicians in the wake of the collected data. When shared between providers, control charts they drive higher standards of care. Patient identification and non-infectious hazards of transfusion are some typical bio-vigilance areas where software process control finds effective application.


References
[1] Continuous quality improvement of perfusion practice. The role of electronic data collection and statistical control chart. RA Baker, RF Newland. Perfusion 2008 23:7-16
[2] Application of statistical process control in healthcare improvement: systematic review. Johan Thor, Jonas Lundberg, Jakob Ask, Jesper Olsson, Cheryl Carli, Karin Pukk Ha¨renstam, Mats Brommels. Qual Saf Health Care 2007;16:387–399. doi: 10.1136/qshc.2006.022194
[3] Operations Management, D.A. Collier, J.R. Evans(2007)
[4] Errors in patient specimen collection: application of statistical process control. Walter Sunny Dzik, Neil Beckman, Kathleen Selleng, Nancy Heddle, Zbigniew Szczepiorkowski, Silvano Wendel, and Michael Murphy for the Biomedical Excellence for Safer Transfusion (BEST) Collaborative (2008)
[5] Health Care Applications of Statistical Process Control: Examples Using the SASâ System Robert N. Rodriguez SAS Institute Inc. Cary, North Carolina, USA
Statistical Process Control is a methodology of statistical analysis used to discover special cause variation in a process. In healthcare, it is used to document that a critical process is in control and alert responsible parties should there be a deviation. A typical control chart is a graphical representation of the quality indicator, as either individual values or calculated subgroups with the data displayed sequentially and time ordered [Refer to illustration 1 in Appendix]. Horizontal lines represent the central tendency (mean), upper and lower control limits typically set at +3 standard deviations from the mean [1]. In this paper, we will list down the types of control charts available and guidelines to interpret it.
Types of Control Charts
In 1920s by Walter Shewhart developed it to improve industrial manufacturing. It first migrated to healthcare in laboratory settings and then into direct patient care applications [2].
There are four commonly used control charts [Refer to illustration 2, 3 in Appendix]. Control are categorized as upper (+) and lower (-).

A process is “in control” when it has the following characteristics [3]:
No points are outside the control limits – the traditional and most popular SPC chart guideline,
The number of points above and below the center line is about the same,
The points seem to fall randomly above and below the center line,
Most points, but not all, are near the centerline, and only a few are close to the control limits.
Evaluating the “patterns in the sample data” using guidelines such as [Refer to illustration 4 in Appendix]:
Eight points in a row above or below the center line
10 of 11 consecutive points above or below the center line
12 of 14 consecutive points above or below the center line
Two of three consecutive points in the outer one-third region between the center line and one of the control limits
Four of five consecutive points in the outer two-thirds region between the centerline and one of the control limits.
Basic Guidelines
In general, in applying statistical process control, we need to delineate the following:
The study and design objectives
Study settings - entire hospital, department etc
Fields of healthcare – anesthesia, pathology etc
Unit of analysis – Clinicians, patient, staff etc
Variables – Oxygen saturation, time to complete etc
Benefits – Impact assessment, quantify process variability etc
However, a number of special issues arise in health care applications of SPC. One of these is the question of what to measure. In health care applications, there is concern and debate about excessive emphasis on outcome metrics and report cards to the detriment of process understanding and improvement. Another issue is the problem of how to aggregate, adjust, and present rate data, used to make decisions [5].
Conclusion
Control charts provide an effective method to visualize data over a specific monitoring period while considering for boundary conditions. Usually the control limits are well within the specification limits for a capable process [Refer to illustration 5 in Appendix]. Continuing use of the control chart helps to check if the corrective action has resulted in an improved process. They allow hospital administrators to have a more engaging conversation with the physicians in the wake of the collected data. When shared between providers, control charts they drive higher standards of care. Patient identification and non-infectious hazards of transfusion are some typical bio-vigilance areas where software process control finds effective application.

References
[1] Continuous quality improvement of perfusion practice. The role of electronic data collection and statistical control chart. RA Baker, RF Newland. Perfusion 2008 23:7-16
[2] Application of statistical process control in healthcare improvement: systematic review. Johan Thor, Jonas Lundberg, Jakob Ask, Jesper Olsson, Cheryl Carli, Karin Pukk Ha¨renstam, Mats Brommels. Qual Saf Health Care 2007;16:387–399. doi: 10.1136/qshc.2006.022194
[3] Operations Management, D.A. Collier, J.R. Evans(2007)
[4] Errors in patient specimen collection: application of statistical process control. Walter Sunny Dzik, Neil Beckman, Kathleen Selleng, Nancy Heddle, Zbigniew Szczepiorkowski, Silvano Wendel, and Michael Murphy for the Biomedical Excellence for Safer Transfusion (BEST) Collaborative (2008)
[5] Health Care Applications of Statistical Process Control: Examples Using the SASâ System Robert N. Rodriguez SAS Institute Inc. Cary, North Carolina, USA
Thursday, June 10, 2010
Process mapping in healthcare
A simple process map is depiction of sequence of information and material flow involving business entities (actors) using a standard set of symbols (BPMN/ADONIS) [1]. In 1921, Frank Gilberth introduced the first structured method for documenting process flows. Enhanced process mapping depicts functional units and roles using swim lanes. They start with level zero and progressively increase showing higher level of granularity. Although not exhaustive, the paper briefly describes the objectives, types, and best practices in process mapping.
Objectives of process maps
Process maps are fundamental to information capture. It is the building block of any new or improvement project.
Even though not always entire objective, a process map reproduces pre-existing reality. It allows us to contrast actual flow to the ideal flow.
They help getting past organizational silos [2].
We may employ process maps in a variety of scenarios like B2B (between organizations as in case of revenue cycle management), B2C (hospital patient interaction like outpatient and inpatient procedures), and B2E (employee to hospital interaction).
Discover complexity, redundancy, and blocks in the process, help to revaluate underlying assumption and predispositions
Identify location where there is a need to collect additional data and investigate [3].
Different types of process map
Process map comes in several flavors each highlight a different aspect and intended for a different audience.
High-level process flow shows core process within the organization. It shows the interaction between entities. Low-level process flow shows decision gates and loops
Cross-functional maps that use swim lanes, which allow the slotting of the activities among department or roles indicating the organizational structure and complexity involved.
Value stream maps that capture wait times, and additional attributes like inventory, throughput, and flow time.
SIPOC diagram which shows the high-level visual between suppliers, inputs, process, outcomes, and customers (refer to appendix).
There may be other variations of process maps, either tailored or derived to meet specific circumstances
Best Practices
Articulate the problem clearly and specifically using information available.
Involve the stakeholder group to participate in the modeling process
Determine the boundary or scope of the process to facilitate data collection and retain focus.
Determine and sequence the steps identifying the start and the end-points and the customer.
Start with high level and drill down progressively. Maintain consistency at each level.
Test for completeness of the map at each level.
The mapping exercise must be led by a facilitator who
Must have a neutral stand
Must set ground rules of engagement
Will create an environment for brain storming
Keep the exercise on track by parking contentious issues, keep focus on “value to the customer”
Conclusion
Process mapping spans across the “Define” and “Measure” phase of DMAIC framework of 6-Sigma and discovery of the “hidden plant” used in Lean. Define-Measure-Analyze-Improve-Control (DMAIC) is a framework for 6-Sigma implementation. The Define phase identifies the opportunity set for improvement and Measure phase quantifies the current state in terms of contextually relevant indicators. Hidden Plant is a lean construct denoting the unreported rework and scrap that goes into the outcome of a process.
Patient focused Integrated Care Pathways (ICP) is a good derivative of process map. They act templates to deliver care fostering evidence based medical practice. The ICP is not rigid but allows the variation in the clinical intervention depending on unique needs of the patient. The ICP serves as a reminder to document the variations in care from published guidelines. This in turn supports management of clinical risks and modification of the contents of the ICP.
Process mapping lays the foundation of any problem solving assignment. It also is an excellent tool to capture and transmit best practices in the organization and in the industry. Sophisticated information systems integrate process maps with packaged application making configuration and customization simpler and easy to maintain. Lean Six Sigma uses this methodology extensively to evaluate as-is state and create to-be state. It allows easy visualization of check- points to measure, monitor, and sustain activities in the process.
References
[1] eBusiness in Healthcare From eProcurement to Supply Chain Management Series: Health Informatics Hübner, Ursula; Elmhorst, Marc A. (Eds.)
[2] What’s in a care pathway? Towards a cultural cartography of the new NHS Ruth Pinder,Roland Petchey,Sara Shaw,Yvonne Carter. Sociology of Health & Illness Vol. 27 No. 6 2005 ISSN 0141–9889, pp. 759–779
[3] The Premier Healthcare Alliance. http://www.premierinc.com/about/mission/social-responsibility/cares/process-maps.pdf
[4] What is an integrated care pathway? Sue Middleton, Jane Barnett, David Reeves. Hayward Medical Communications. www.evidence-based-medicine.co.uk
[5] A toolkit for Redesign of healthcare. AHRQ. http://www.ahrq.gov/qual/toolkit/tkformf.htm
[6] http://facultyweb.berry.edu/jgrout/processmapping/Swim_Lane/swim_lane.html
[7] http://www.hfma.org/Templates/InteriorMaster.aspx?id=21198
Wednesday, January 6, 2010
My Takeaway from Michael L George’s Lean Six Sigma for Services Final Part
The nature of service work makes it difficult to find out what needs change and how to transform. The work product is often invisible making it difficult to track the flow. Service industry is has a long tradition of being individualistic. People are protective about losing their creativity to standardization. It is vital to engage the people instead of enforcing compliance. Data in service industry is neither organized nor readily available. More often than not decisions are judgment or Delphi based. People do not respond to inputs/instructions as do machines. The sheer unpredictability of human behavior is daunting.
Recognizing waste in service is critical to a successful LSS initiative:
• Over processing – PMI calls it “Gold Plating.” It may also include inefficient iterations of work product, unnecessary handoffs, creation of cumbersome documentation, etc.
• Transportation and motion – A lot of effort goes in information chasing. The data or the person having the data is difficult to reach out. The lack of resources may be result in information waiting at desktops for being processed.
• Inventory and waiting time – Non-value added work upstream increases downstream wait time. Skill and resource bottlenecks are also contributors
• Defect – Lost communication, miscommunication result in work product being incomplete or contrary to customer needs.
• Overproduction – Poor prioritization or work qualification leads to over commit and under deliver
Some useful ideas for running initiatives in service industry:
• Be creative in meetings – Use the meeting times wisely. Collect data offline. Use meetings to analyze information, make decisions, and have concrete takeaways.
• Look for obvious quick hit opportunities – Pick up low hanging fruit and use the results of those initiatives to promote initiatives in more critical areas.
• Use improvement events like Kaizen (traditional or improvised) to generate energy and immediate gains.
• Reach out beyond team boundaries.
• Set realistic expectation – A single projects does not produce best in class improvements. Processes are generally littered with variation and not managed with even a general understanding of velocity and flow. These are 2 distinct deficiencies and need to addressed separately
• Pay attention to team composition – Dr. Belbin’s model offers a good guideline, manage expectation
• Be conscious of your audience – Improvise tools and method to suit the organization, lead by example.
DMAIC
A typical LSS project begins with a one-page charter with sufficient data to compute benefits, resource requirements, and ROIC estimates. Basic elements of DEFINE include
• Consensus on the problem
• Understand the project link to corporate strategy and ROIC
• Agree on project boundaries/scope of value stream
• Know the key metrics or indicators of success (people must be able to make sense of it)
MEASURE bases on data and separates Six Sigma from a general process tinkering activity. Common data gathering challenges include too little data, no data, too much data, and irrelevant data. Useful steps in measure are
• Establish baseline – Measure useful data like things-in-process, average completion rate, cycle time, first pass yield, approvals/handoffs, downtime/learning curve, defects that affect the customer, and complexity
• Impartially observe the process – Watch people, track emails, phone calls, set goals for observation, ensure consistent data collection
The purpose of ANALYZE is to make sense of the data collected so far. The key part is to stick to the data and not be colored by individual experience and opinions. It may use scatter diagram to correlate variables. Time trap analysis can identify improvement areas.
IMPROVE applies standard tools implement brainstormed alternatives. The tools include those for setup time reduction (learning curve, upstream batching), 5S (De-cluttering), and queuing methods for decongestion (Staff pooling/cross training, task slotting/triaging, back up capacity, variation reduction). In a philosophical sense, nothing really changes except that the universe rearranges to be more efficient. Things like sponsor support and communication are of essence in this stage
A standard rule says we must spend time on a task only 10 times as much as it takes to set the task up. Some important questions for setup time reduction.
• What is delaying the start of work
• What factors lead to work interruption
• What inhibits moving at full throttle
• Is there any redundancy
• Is there a possibility for rationalization/ task offloading/ streamlining
• How to apply statistical control
The aim of CONTROL is to preserve the gains made in improve till yet another generation of improvement happens. Key steps are
• Documentation – to ensure people don’t slip back into old habits
• Convert results into currency – Project need financial validation and verification not be mere feel good factor. Not all gains are financially tangible. Verify the results at later points in time to ensure consistent returns
• Set up alerting mechanism to catch when the process spins out of control
Control is the cross over point when the process owner will take charge.
The book is an amazing read.
Friday, January 1, 2010
My Takeaway from Michael L George’s Lean Six Sigma for Services Part 3
Implementation
For and organization considering LSS the biggest challenges are barriers in execution and interaction issues.
According to McKinsey, 80% of the failures in change management are due to
• No performance focus
• Lack of winning strategy
• Failure to have a good case for change
• Not distinguishing between data driven and behavior driven change
• Failure to engage and mobilize pivotal groups
• Over reliance on structure and system to change behavior
• Lack of skills and resources
• Inability to confront changes in organizational roles
• Inability to integrate and align initiatives
Major LSS opportunities lie in the white space between functions that transcend traditional boundaries. When key influencers appreciate the cross functional opportunities using LSS, the roll out becomes smooth. LSS training orients managers to be data centric in their problem solving approach. They are able to separate the outliers from the patterns and prevent “tampering” which often results in added variation. Cutting cost is not the same as cutting people. LSS projects need constant attention for possible course correction and retraining.

Wednesday, December 23, 2009
My Takeaway from Michael L George’s Lean Six Sigma for Services Part 2
Using the Voice of the Customer

Aligning corporate strategy with LSS
The flow from high-level strategy to individual projects requires an understanding of where and how value creation.

Some definitions:
Economic Profit% = % change in Return on Invested Capital – weighted % cost of Capital
Economic Profit = Owners Earning / Invested capital = (Profit after tax) – (3 year average CAPEX)
+ (D&A) – (Increase in working capital)
Process Cycle Efficiency = Value added time / Total lead time
Lead Time = Amount of WIP / Average completion rate
Waste Driver = (Total Demand) x (Set up Time) x (No. of different offerings) / [1 – (Defect Rate) – (total demand) x (Processing time)]
Capacity constraints limits output whereas a time trap causes the longest delays in the stream
Monday, December 21, 2009
My Takeaway from Michael L George’s Lean Six Sigma for Services Part 1
Basics
Similarity
• Both Lean and Six Sigma (SS) help reduce process complexity.
• Both are data driven and measurable and have a framework for effective problem solving
• Both need to be supported by people (from top to bottom) and culture
• Both reinforce each other such that return on invested capital ( goods and people) is faster compared to what is achieved if anyone is implemented
Dissimilarity
• SS recognizes the variation in process that hinders consistent quality outcomes
• Lean centers on identifying and eliminating waste (non value adding) activities and improve the flow speed
• SS is prescriptive in its approach whereas Lean is more inrospective not mandating where the voices of the customer must be included.
There is a preconceived notion that both SS and Lean are only for manufacturing, however that is far from real. In service applications, costs that add no value to the customer are higher than in manufacturing in terms of percentage and absolute dollar value. Because, manufacturing used both these methodologies were widely, the terminology like WIP, workstation turnover, pull systems etc appear to have no meaning for people from services industry.
Why services are replete with waste:
Service processes are slow. Slow processes are usually expensive and prone to poor quality. A service process is usually slow due to wait and queuing. Lack of information, multiple decision loops, and red tape are common waste generators.
Lean Six Sigma (LSS) is about getting rapid results, which track to the bottom line in support of strategic objectives. It allows organization to leverage cost, quality and speed rather than making a tradeoff between them.
Core elements of SS
A powerful SS concept is that the outcomes of a process are a result of the inputs to the process. Y = f(X1, X2, X3,,, Xn). A deeper meaning to this equation is that the LSS team must discover the various Xs that will actually alter the outcome Y. A promise of SS is that one full time Master Black Belt will be able to generate $500,000 worth of increased operating profit per year. To facilitate a SS project, basic requirements include the involvement of senior management, essential workforce training, resource allocation, and reduction of the variations in the CTQ (Critical to Quality) requirements of the customer.
A handful of terms
Lead-time = Amount of WIP/Average completion rate (Little’s Law). WIP can be emails, calls, orders etc. Reducing WIP cost mostly intellectual capital whereas it takes investment capital to alter the completion rate (Usually used when the work involves a direct customer handling. Customers are not the same as Things-in-Process and often show unpredictable patterns in demand).
Delay (Q time) = Time for which a task sits waiting to be worked upon
Value add / non-value add = any work that the customer will pay for is value add. Anything else is non-value add (waste). Long set up times are also non-value adds.
Process efficiency = Value add time/Total lead time
Core elements of Lean
Most processes are “fat.” One mechanism of controlling lead-time is to reduce WIP. Every process should operate on pull to eliminate variation in lead-time. Each organization needs to create its own pull system. Pareto’s principle of 80/20 is valid. Only work that is visible (data based) can be improved. In services, it is difficult to draw out the process and even more difficult to judge the amount of WIP. A good example of such an activity is the set up time or bring lock in period in moving from one task to the other.
High velocity of an object through a process does not reduce quality because the speed comes by reducing wasteful activities and not the key steps. A lean service process typically is one whose value added time is at least 20% of cycle time.
Why do they need each other
It is important to note that speed and cost gains from lean can instantly be erased by an increase in variation leading to WIP and lead times.Conversely any process (even the near perfect ones) will eventually become slow, cumbersome and coslty if it is not continuously tuned for reducing waste.
Subscribe to:
Posts (Atom)